Tracking solar panel output and cost savings in Python
[updated graphs 2024-01-24]
Ever since we installed solar panels on our roof, I’ve been mildly obsessed with tracking its power output and our electricity consumption. The installation was done at the end of September of last year so I have yet to see its full potential!
I had three questions I wanted to answer:
- How much of our solar panel output do we consume ourselves?
- What part of our total energy consumption is covered by the solar panels?
- How much money are we actually saving?
In order to answer these questions, I needed to combine the data from two different sources:
- The solar panel power output - from the solar panel system itself
- Our monthly electricity consumption and injection into the grid + prices - from our energy bills.
Solar panel system data
The solar panel system has a SolarEdge inverter, which connects to the internet and through an API, I can monitor the electricity output. For technical details, information can be found here. I’ve added a code snippet below as an example of how to obtain the information from the SolarEdge API.
Getting data from the energy bill
I’ve asked our energy provider (Luminus) for monthly bills that reflect our true consumption. I don’t know how it is in other countries, but here, typically you pay an advance (which is probably too high) and the balance is settled once a year. But I preferred to know how much we consume, and pay for it, each month. At least in Belgium (or perhaps only Flanders), this is possible with some providers, see also here. It took Luminus a while to change to monthly bills, that’s why I only have data from January 2023.
Based on these monthly invoices, I used a Python package called pypdf to convert the PDF to plain text and then I lifted the
useful information from that using regular expressions (re) and a lot of patience.
I wanted to split the costs into the parts that are per kWh and the fixed parts, distinguish between
day and night rates, and between injecting into and drawing from the grid.
The details of how to parse the PDF and return a
Pandas dataframe are a bit boring, but you can find
the code right here.
A few things to remember if you want to try this yourself:
- Of course invoices from different providers will have different structures, so you’ll probably need to rewrite most of the code involving regular expressions unless your provider is Luminus (you need the detailed invoice).
- I don’t know if it would work from a yearly bill.
- pypdf doesn’t always extract characters in the unicode you might expect. I lost quite a bit of time until I realized that
'-' == '-'returnedFalsebecause of that. So best to copy-paste bits of text from the string returned by pypdf if you want to use it in regular expression searches.
Putting this together
Once the hard part is out of the way, the interesting part begins. By subtracting the injected energy from the total solar panel output, you can find out how much of your own solar power you consume yourself. Add that to the energy you got from the grid, and you know how much you consumed in total. All of this is easily done in pandas. I won’t put all of the code here because it’s rather straighforward but probably too specific for my case to be useful. But if you’re interested, reach out to me and I’ll happily share it.
I now have a Jupyter notebook where I just need to enter the paths to the monthly bills, and it automatically generates the following graphs.
Here’s the solar panel output in kWh each month, split by own consumption (blue) and what’s injected into the grid (sold, orange):
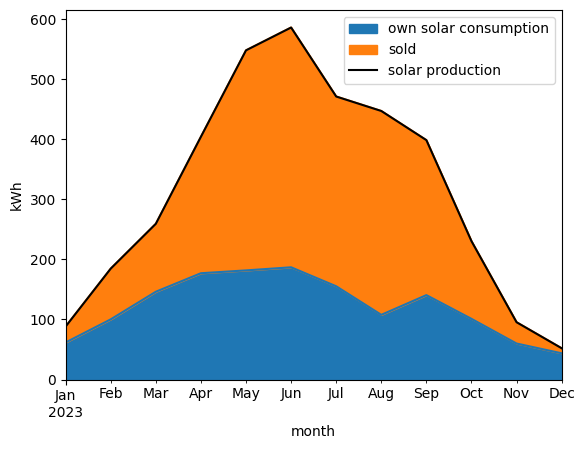
Clearly, as we advance from winter to spring, we get more solar energy, yay!
Here’s the electricity consumption split by solar (blue) and what we’ve taken from the grid (bought, orange):
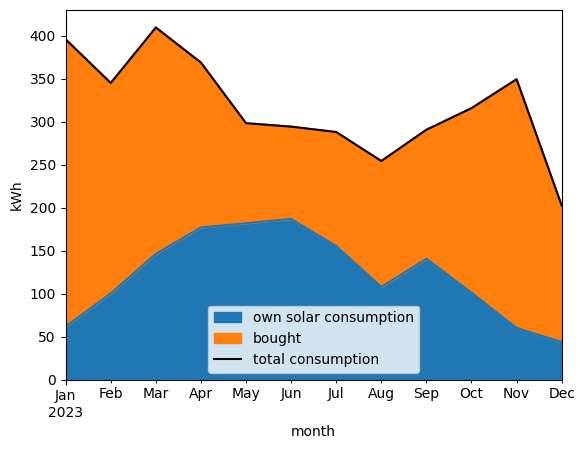
Our energy usage doesn’t change too much month-to-month (and of course, February is notoriously short, hence the dip). But the share of solar energy increases.
The following graph reflects how the solar panels save us money every month:
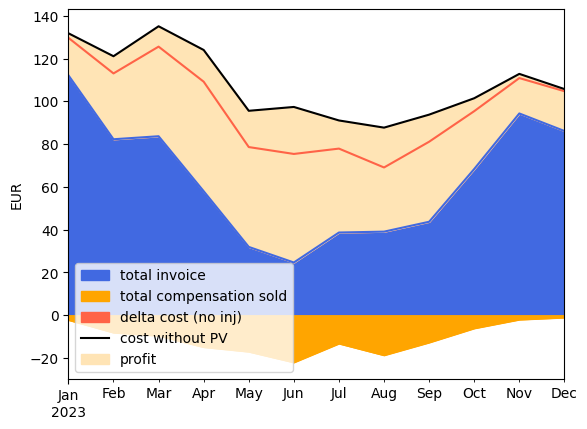
The blue color shows what we pay to the provider. The black line is what we would have to pay if we consumed the same amount of electricity but didn’t have solar panels. The difference is the cost savings we make (or profit), which can be split into a part that is compensation for what we inject into the grid (orange, and not so much) and the part that is due to what we didn’t need to buy - indicated by the difference between the blue area and the red line. I guess I could work on my data-viz skills but it makes sense to me…
Our cumulative savings for these three months is about EUR 185, which doesn’t extrapolate to a <5 year pay back of the solar panels, but let’s hope that these three months underrepresent the amount of sunshine we can expect for the rest of the year! But you never know. This is Belgium.
One additional note: of course I’m comparing the case where we have solar panels to the case where we have the exact same behavior but without solar panels. It’s not exactly apples and oranges but perhaps it’s Pink Lady and Jonagold. Because without solar panels, I wouldn’t be turning on my dishwasher depending on the amount of clouds in the sky. So our true consumption would probably be a bit lower without the solar panels than what I’ve calculated here - mainly because of the difference in day and night rates.
Conclusion:
Even though I truly love regular expressions in Python, this was also the hardest part to get to work. If you’re only interested in the energy production and consumption and not so much the exact costs, you might also just download CSV data from Fluvius (in Belgium) with your consumption and injection data. If you have a fixed energy price, you could probably get a pretty good estimate of your cost savings. I don’t know about other brands of solar panel inverters, but I assume most of them have some kind of API. If there’s an app, they probably have an API. I had to enable the API through the website.
Also: I’m not only interested in the money! But I think it’s good to have an idea of my own behaviour and how I can optimize my energy consumption. For instance, the fact that I’m still injecting electricity into the grid, while I’m not covering all of my consumption with solar energy, means there’s room to improve my dishwasher schedule!
And of course I’m hoping to convince people to invest in renewable energy.
Code snippet to obtain solar panel output from SolarEdge API
import requests
import pandas as pd
import numpy as np
import arrow
SE_API_KEY = 'SOME_KEY'
SE_SITE = 'SOME_SITE'

def day_or_night(arr):
    hour = int(arr.format("H"))
    day = arr.format("ddd")
    if day in ["Sat", "Sun"]:
        return "night"
    elif hour > 22:
        return "night"
    elif hour <= 7:
        return "night"
    else:
        return "day"

def get_pv(start, end, raw=False):
    url_se = f"https://monitoringapi.solaredge.com/site/{SE_SITE}/energy?timeUnit=HOUR&endDate={str(end.date())}&startDate={str(start.date())}&api_key={SE_API_KEY}"
    response_se = requests.get(url_se)
    if raw:
        return response_se
    json_se = response_se.json()
    df_se = pd.json_normalize(json_se['energy']['values'])
    df_se['time'] = df_se['date'].apply(lambda x: arrow.get(x, tzinfo='local'))
    df_se = df_se.set_index('time').drop(columns=['date'])
    df_se = df_se.replace(np.nan,0)
    df_se['rate'] = [day_or_night(t) for t in df_se.index]
    return df_se